[Quipu Issue Paper] Genome Annotation Ⅰ- Structural annotation
- Posted at 2010/03/15 13:34
- Filed under 생물정보
연재 순서
1. Assembly
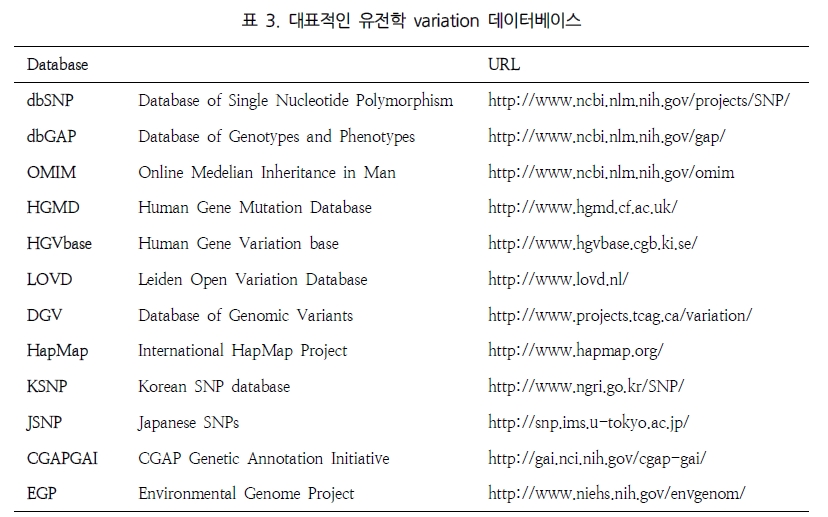
2. Variation study
3. Expression study
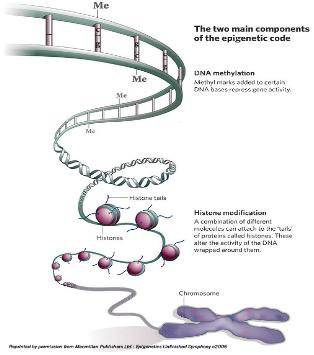
4. Epigenomics
5. Genome Annotation
6. Next Generation Bioinformatics
7. Data Management for web 2.0 Era
8. Semantic Network for Integrated Biology Data
9. Gene Network Discovery by Text-mining
10. Centralization for High-throughput Data Analysis
이번 연재에서는 약 2주에 걸쳐 유전체 내의 유전자 위치와 기능을 해독하는 과정인 Genome Annotation에 대해 연재가 될 예정입니다. 오늘은 Genome Annotation 중에서도 첫번째 단계인 유전체 서열 내에서 유전자의 위치와 구조 정보를 밝혀내는 Structural annotation에 대해 알아보겠습니다.
2-4. Genome Annotation
2009년 현재 human을 비롯한 mammalian에서 microbial까지 많은 유전체 프로젝트가 완료되었거나 진행되고 있으며, NCBI의 사이트에서 그 내용을 확인할 수 있다. 이렇게 다양한 종에서 완료되었거나 진행 중인 유전체 프로젝트는 NGS 시대를 맞이하여 더욱 가속화 되었다. 유전체 프로젝트는 유전체 서열을 시퀀싱을 통해 추출하는 단계와 유전체 내의 유전자 위치와 기능을 해독하는 단계로 구성된다. 여기서 유전체 내의 유전자 위치와 기능을 해독하는 과정을 genome annotation이라고 정의하며, genome annotation은 세 가지 과정으로 구분할 수 있다. 유전체 내의 유전자에 대한 구조적 정보를 분석하는 structural annotation, 유전자의 기능을 규명하는 functional annotation, 그리고 마지막으로 수학적 알고리즘으로 밝혀지지 않는 부분을 생물학 전문가가 면밀히 분석하는 manual curation 과정으로 구성되어 있다. 이번 장에서는 genome annotation에 대한 세 가지 과정에 대하여 구체적으로 알아보고자 한다.
2-4-1. Structural annotation
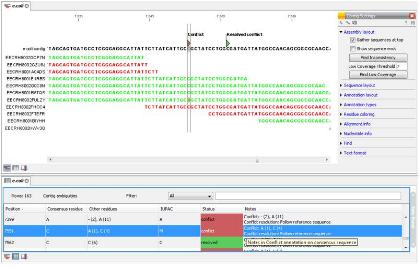
Genome annotation의 첫 번째 단계인 structural annotation은 유전체 서열 내에서 유전자의 위치와 구조 정보를 밝혀내는 것을 목적으로 하여 유전체 서열 전체의 유전자 지도를 완성한다. 유전체 서열에는 실제 단백질을 코딩하는 유전자 영역과 그 외 나머지 영역으로 크게 나눠진다. 그중 유전자는 exon과 intron으로 나눠지고 유전자의 발현을 조절하는 프로모터 영역이 일반적으로 유전자의 앞단에 위치하고 있다(그림 1).
유전체 내의 유전자의 위치 정보와 상세 구조정보를 규명한다.
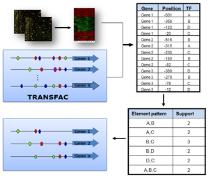
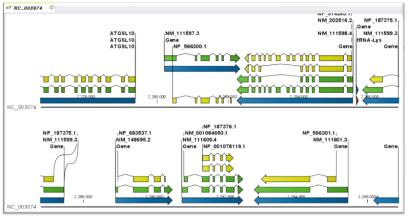
또한 유전체 서열의 상당 부분을 차지하고 있는 반복 서열과 transposon elements 들도 유전체의 다양한 영역에 존재하고 있다. 인간 유전체의 경우 약 30억 쌍의 염기서열 중 실제 단백질로 코딩되는 영역인 엑손 영역은 전체 염기 중 단 1%에 불과하다. 99%의 나머지 서열은 non-cording RNA, intron, repeat, regulation 영역이 대부분 차지하고 있다. 따라서 유전체에서 여러 가지 형태의 서열들에 대한 위치 정보를 다양한 데이터베이스와 알고리즘을 이용하여 분석하고 있으며, 과정은 다음과 같다(그림 2).
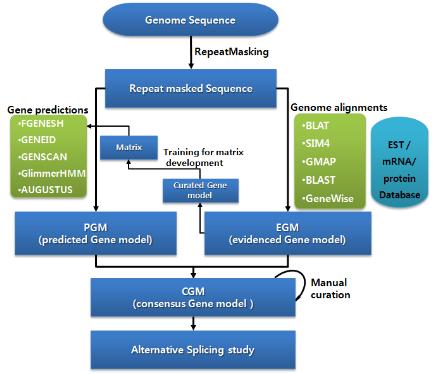 그림 2. Structural annotation 워크플로우.
Ab initio 와 유전체 매핑을 결합한 방식.
Ab initio 와 유전체 매핑을 결합한 방식.
다음 연재에서는 진핵생물의 유전체 서열 중 가장 많은 영역을 차지하는 반복서열 분석법과 유전자 모델링 중에서 유전자의 위치를 예측하는 유전자 예측에 대해 알아보겠습니다.
많은 관심 부탁드립니다.
참고문헌
1. Lowe, T.M. and Eddy, S.R. (1997) tRNAscan-SE: a program for improved detection of transfer RNA genes in genomic sequence. Nucleic Acids Res. 25, 955-964.
2. Lewis SE, et al. (2002). Apollo: a sequence annotation editor. Genome Biology. 12, research0082
3. Noh SJ, Lee K, Paik H, Hur CG. (2006) TISA: tissue-specific alternative splicing in human and mouse genes. DNA Res. 13, 229-243
4. Stanke M, Schoffmann O, Morgenstern B, Waack S. (2006) Gene prediction in eukaryotes with a generalized hidden Markov model that uses hints from external
sources. BMC Bioinformatics. 7, 62.
5. Burge, C. and Karlin, S. (1997) Prediction of complete gene structures in human genomic DNA. J. Mol. Biol. 268, 78-94.
6. Salamov AA, Solovyev VV. (2000) Ab initio gene finding in Drosophila genomic DNA. Genome Res. 10, 516–522.
7. Majoros, W.H., Pertea, M., and Salzberg, S.L. TigrScan and GlimmerHMM: two open-source ab initio eukaryotic gene-finders Bioinformatics 20, 2878-2879.
8. G. Parra, E. Blanco, and R. Guigó, (2000) Geneid in Drosophila Genome Research 4, 511-515.
9. Haas BJ, Salzberg SL, Zhu W, Pertea M, Allen JE, Orvis J, White O, Buell CR, Wortman JR. (2008) Automated eukaryotic gene structure annotation using
EVidenceModeler and the Program to Assemble Spliced Alignments. Genome Biology 9, R7
10. Korf I. (2004) Gene finding in novel genomes. BMC Bioinformatics. 5, 59.
11. Kan, Z., Rouchka, E.C., Gish, W., and States, D. 2001, Gene structure prediction and AS analysis using genomically aligned ESTs, Genome Res. 11, 889–900.
12. Eyras, E., Caccamo, M., Curwen, V., and Clamp, M. 2004, ESTGenes: AS from ESTs in Ensembl, Genome Res. 14, 976–987.
13. Kent, W.J. 2002, BLAT-The BLAST-Like Alignment Tool, Genome Res. 12, 565–664.
14. Florea, L., Hartzell, G., Zhang, Z., Rubin, G.M., Miller, W. 1998, Computer program for aligning a cDNA sequence with a genomic DNA sequence, Genome Res. 8,
967–974.
15. Huang X, Adams MD, Zhou H, Kerlavage AR. (1997) A tool for analyzing and annotating genomic sequences. Genomics. 46, 37–45.
16. Wu TD, Watanabe CK. (2005) GMAP: a genomic mapping and alignment program for mRNA and EST sequences. Bioinformatics. 21, 1859–1875.
17. Birney E, Clamp M, Durbin R. (2004) GeneWise and Genomewise. Genome Res. 14, 988–995.
Posted by 人Co
- Tag
- Ab initio, Genome Annotation, insilicogen, manual curation, NGS, Structural annotation, 반복서열 분석법, 유전자 예측, 인실리코젠
- Response
- No Trackback , No Comment
- RSS :
- https://post-blog.insilicogen.com/blog/rss/response/57