[Quipu Issue Paper] Expression Study Ⅱ- Digital Expression Profile(DEP)
- Posted at 2010/02/23 09:50
- Filed under 생물정보
연재 순서
1. Assembly
2. Variation study
3. Expression study
4. Epigenomics
5. Genome Annotation
6. Next Generation Bioinformatics
7. Data Management for web 2.0 Era
8. Semantic Network for Integrated Biology Data
9. Gene Network Discovery by Text-mining
10. Centralization for High-throughput Data Analysis
이번 연재에서는 Next Generation Sequencing의 두 번째 Application인 Expression study 중에 Digital Expression Profile(DEP) 작성하는 방법에 대해 알아보도록 하겠습니다.
동일한 유전자로 부터 발현된 mRNA의 양은 중복된 NGS reads의 개수를 계산함으로써 알 수 있다. 따라서 클러스터링 과정을 통해 중복된 reads를 동일 유전자에서 유래한 하나의 서열로 만들 수 있고 이렇게 형성된 unigene의 reads count profile은 결국 mRNA의 expression profile과 동일시 볼 수 있다[3]. 여러 조직에서 다양한 발현 양을 보이는 유전자의 경우 각 조직마다의 발현양은 시퀀싱된 reads 개수를 계산하는 방법으로 Digital Expression Profile(DEP)의 초기 데이터인 Cluster member matrix를 만들 수 있다(그림 2)[10, 17]. 앞서 언급한 마이크로어레이 분석에서도 Intensity value를 실제 분석에 앞서 다양한 정규화과정(Normalization)을 수행하는 것과 같이 DEP에서도 두 단계의 정규화과정을 통해 최종적인 DEP를 완성한다[2].
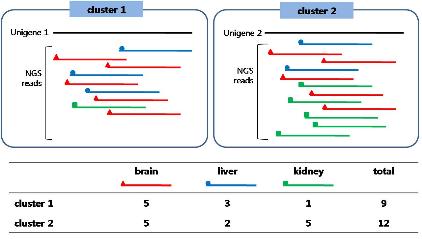 그림 2. Cluster Member Matrix(CMM).
2. Fei Z, Tang X, Alba RM, White JA, Ronning CM, Martin GB, Tanksley SD, Giovannoni JJ. (2004) Comprehensive EST analysis of tomato and comparative genomics of fruit ripening. Plant J. 40, 47–59
3. Rensink WA, Lee Y, Liu J, Iobst S, Ouyang S, Buell CR. (2005) Comparative analyses of six solanaceous transcriptomes reveal a high degree of sequence conservation and species-specific transcripts. BMC Genomics. 6, 124
4. Ronning,C.M. et al. (2003) Comparative analyses of potato expressed sequence tag libraries. Plant Physiol. 131, 419–429
5. Guo J, Zhu P, Wu C, Yu L, Zhao S, Gu X. (2003) In silico analysis indicates a similar gene expression pattern between human brain and testis. Cytogenet Genome Res. 103, 58-62
6. Benjamini, Y., Daniel Yekutieli. (2001) The control of the false discovery rate in multiple hypotheses testing under dependency. Annal. Stat. 4(29), 1165–1188
7. Tsai CA, Hsueh HM, Chen JJ. (2003) Estimation of false discovery rates in multiple testing: application to gene microarray data. Biometrics. 59, 1071-81
8. Audic S, Claverie JM. (1997) The significance of digital gene expression profiles. Genome Res. 7, 986–995
9. Roche 454 : Products & Solutions - Multiplexing
(http://www.454.com/products-solutions/experimental-design-options/multiplexing.asp)
10. Tatusov RL, Koonin EV, Lipman DJ. (1997) A genomic perspective on protein families. Science. 278, 631-637
11. Kato T, Murata Y, Miura K, Asai K, Horton PB, Koji T, Fujibuchi W. (2006) Network-based de-noising improves prediction from microarray data, BMC Bioinformatics. 7, S4
12. Noh SJ, Lee K, Paik H, Hur CG. (2006) TISA: tissue-specific alternative splicing in human and mouse genes. DNA Res. 5, 229-243
13. Zeeberg BR, Feng W, Wang G, Wang MD, Fojo AT, Sunshine M, Narasimhan S, Kane DW, Reinhold WC, Lababidi S, Bussey KJ, Riss J, Barrett JC, Weinstein JN. (2003) GoMiner: a resource for biological interpretation of genomic and proteomic data, Genome Biol. 4, R28
14. GeneSpring GX : Products & Services - GeneSpring GX Software
(http://www.chem.agilent.com/en-US/products/software/lifesciencesinformatics/genespringgx/pages/default.aspx)
15. Wingender E, Chen X, Hehl R, Karas H, Liebich I, Matys V, Meinhardt T, Prüss M, Reuter I, Schacherer F. (2000) TRANSFAC: an integrated system for gene expression regulation. Nucleic Acids Research. 28, 316-319
16. PathwayStudio : Products-pathway Studio
(http://www.ariadnegenomics.com/products/pathwaystudio/)
17. Eveland AL, McCarty DR, Koch KE. (2007) Transcript profiling by 3'-untranslated region sequencing resolves expression of gene families. Plant Physiol. 146, 32-44.
18. Torres TT, Metta M, Ottenwälder B, Schlötterer C. (2008) Gene expression profiling by massively parallel sequencing. Genome Res. 1, 172-7.
19. Vega-Arreguín JC, Ibarra-Laclette E, Jiménez-Moraila B, Martínez O, Vielle-Calzada JP, Herrera-Estrella L, Herrera-Estrella A. (2009) Deep sampling of the Palomero maize transcriptome by a high throughput strategy of pyrosequencing. BMC Genomics. 10, 299.
20. Wang ET, Sandberg R, Luo S, Khrebtukova I, Zhang L, Mayr C, Kingsmore SF, Schroth GP, Burge CB. (2008) Alternative isoform regulation in human tissue transcriptomes. Nature. 2456, 70-76.
21. Johnson JM, Castle J, Garrett-Engele P, Kan Z, Loerch PM, Armour CD, Santos R, Schadt EE, Stoughton R, Shoemaker DD. (2003) Genome-wide survey of human alternative pre-mRNA splicing with exon junction microarrays. Science. 302, 2141-2144.
22. Ledford H. (2008) Human genes are multitaskers. Nature. 456, 9.
23. CLC Genomics Workbench: RNA-Seq analysis
(http://www.clcbio.com/index.php?id=1330&manual=RNA_Seq_analysis.html)
1. Assembly
2. Variation study
3. Expression study
4. Epigenomics
5. Genome Annotation
6. Next Generation Bioinformatics
7. Data Management for web 2.0 Era
8. Semantic Network for Integrated Biology Data
9. Gene Network Discovery by Text-mining
10. Centralization for High-throughput Data Analysis
이번 연재에서는 Next Generation Sequencing의 두 번째 Application인 Expression study 중에 Digital Expression Profile(DEP) 작성하는 방법에 대해 알아보도록 하겠습니다.
2-2-1. Digital Expression Profile (DEP)
동일한 유전자로 부터 발현된 mRNA의 양은 중복된 NGS reads의 개수를 계산함으로써 알 수 있다. 따라서 클러스터링 과정을 통해 중복된 reads를 동일 유전자에서 유래한 하나의 서열로 만들 수 있고 이렇게 형성된 unigene의 reads count profile은 결국 mRNA의 expression profile과 동일시 볼 수 있다[3]. 여러 조직에서 다양한 발현 양을 보이는 유전자의 경우 각 조직마다의 발현양은 시퀀싱된 reads 개수를 계산하는 방법으로 Digital Expression Profile(DEP)의 초기 데이터인 Cluster member matrix를 만들 수 있다(그림 2)[10, 17]. 앞서 언급한 마이크로어레이 분석에서도 Intensity value를 실제 분석에 앞서 다양한 정규화과정(Normalization)을 수행하는 것과 같이 DEP에서도 두 단계의 정규화과정을 통해 최종적인 DEP를 완성한다[2].
Clustering을 통한 유전자
발현 counting. De novo assembly를 통해
각 cluster(consensus sequence) 마다의 NGS reads를 조직별로 counting 하여
Digital Expression Profile(DEP)의 초기데이터인 clutser member matix를 완성한다.
각 cluster(consensus sequence) 마다의 NGS reads를 조직별로 counting 하여
Digital Expression Profile(DEP)의 초기데이터인 clutser member matix를 완성한다.
A. Library Normalization
특정 라이브러리가 다른 라이브러리들에 비해 유독 많이 시퀀싱되어 reads의 양이 많다면, 클러스터링을 통해 얻어진 클러스터 내의 reads 또한 다른 라이브러리에 비해 많이 나타날 것이다. 이는 실제 세포내의 발현 양이라기보다는 데이터 세트 자체의 시퀀싱 개수가 많아서 생기는 것이므로 라이브러리별로 특정 유전자가 그 조직에서 얼마만큼의 발현이 이뤄졌는지를 비율을 통해 나타내야 한다. 따라서 특정 클러스터의 reads 개수에서 그 라이브러리 전체 reads 개수 만큼을 나눠주는 정규화방식이다.
B. Unigene Normalization
Library normalization 수행으로 각 라이브러리에서의 발현 비율로 unigene의 발현 정도를 얻을 수 있다. 그러나 이때 house-keeping 유전자의 경우에 늘 많이 발현되는 유전자이므로 전체적으로 발현 비율이 높다. 반면 그렇지 않은 유전자의 경우 수치가 전체적으로 낮게 나타난다. 이럴 경우, 수치상의 차이가 너무 크기 때문에 라이브러리별 혹은 컨디션별로 유전자의 발현 패턴을 보고자 할 때 너무 높은 발현 수치로 인해 상대적으로 낮은 수치로 일정 패턴을 갖는 유전자는 그 의미가 퇴색되어진다. 이러한 점을 정규화 하기 위해 median value로 나눠주거나, log ratio 취하여 유전자간 수치적 차이를 최소화 하게 한다. Median value 정규화 과정은 그림 3에서 보는 것과 같이 각 클러스터(unigene) 별로 1차 library 정규화 결과 값들을 대상으로 그 중간 값인 0.000341853(media value)로 나눠준다. 그러면 중간 정도의 발현 값을 보이는 라이브러리인 ‘ZG’ 에서는 값이 ‘1’이 나오고 되고, 세포내 전체적인 평균 발현 보다 높은 발현은 ‘1’보다 높은 수치로 정렬되며, ‘1’ 이하는 낮은 발현을 나타내게 된다. 이렇게 두 단계의 정규화 수행 후 최종적인 DEP를 완성하게 된다.
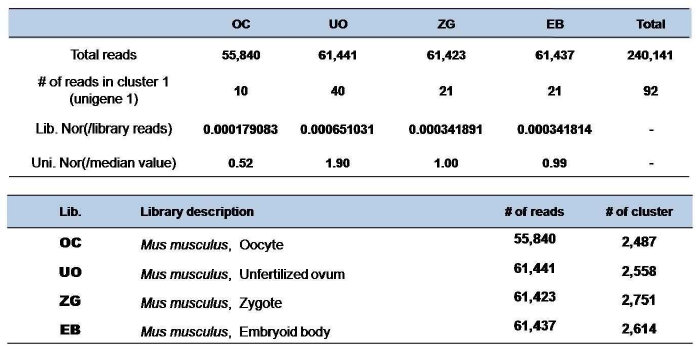 그림 3. Digital Expression Profile (DEP).
많은 관심 부탁드립니다.
특정 라이브러리가 다른 라이브러리들에 비해 유독 많이 시퀀싱되어 reads의 양이 많다면, 클러스터링을 통해 얻어진 클러스터 내의 reads 또한 다른 라이브러리에 비해 많이 나타날 것이다. 이는 실제 세포내의 발현 양이라기보다는 데이터 세트 자체의 시퀀싱 개수가 많아서 생기는 것이므로 라이브러리별로 특정 유전자가 그 조직에서 얼마만큼의 발현이 이뤄졌는지를 비율을 통해 나타내야 한다. 따라서 특정 클러스터의 reads 개수에서 그 라이브러리 전체 reads 개수 만큼을 나눠주는 정규화방식이다.
B. Unigene Normalization
Library normalization 수행으로 각 라이브러리에서의 발현 비율로 unigene의 발현 정도를 얻을 수 있다. 그러나 이때 house-keeping 유전자의 경우에 늘 많이 발현되는 유전자이므로 전체적으로 발현 비율이 높다. 반면 그렇지 않은 유전자의 경우 수치가 전체적으로 낮게 나타난다. 이럴 경우, 수치상의 차이가 너무 크기 때문에 라이브러리별 혹은 컨디션별로 유전자의 발현 패턴을 보고자 할 때 너무 높은 발현 수치로 인해 상대적으로 낮은 수치로 일정 패턴을 갖는 유전자는 그 의미가 퇴색되어진다. 이러한 점을 정규화 하기 위해 median value로 나눠주거나, log ratio 취하여 유전자간 수치적 차이를 최소화 하게 한다. Median value 정규화 과정은 그림 3에서 보는 것과 같이 각 클러스터(unigene) 별로 1차 library 정규화 결과 값들을 대상으로 그 중간 값인 0.000341853(media value)로 나눠준다. 그러면 중간 정도의 발현 값을 보이는 라이브러리인 ‘ZG’ 에서는 값이 ‘1’이 나오고 되고, 세포내 전체적인 평균 발현 보다 높은 발현은 ‘1’보다 높은 수치로 정렬되며, ‘1’ 이하는 낮은 발현을 나타내게 된다. 이렇게 두 단계의 정규화 수행 후 최종적인 DEP를 완성하게 된다.
Cluster Member Matrix(CMM)을 바탕으로 두 단계의
normalization 과정을 통해 표준화된 expression value로 환산 된다.
normalization 과정을 통해 표준화된 expression value로 환산 된다.
이렇게 완성된 DEP는 다양한 발현 패턴 분석에서부터 조직 특이 유전자 그리고 Ortholog 분석에도 이용된다.
다음 연재에서는 Expression study 중에 Digital Expression Profile(DEP)를 활용한 Expression pattern 분석에 대해 알아보도록 하겠습니다.많은 관심 부탁드립니다.
참고문헌
1. Mortazavi A, Williams BA, McCue K, Schaeffer L, Wold B. (2008) Mapping and quantifying mammalian transcriptomes by RNA-Seq. Nat Methods. 7, 621-628.2. Fei Z, Tang X, Alba RM, White JA, Ronning CM, Martin GB, Tanksley SD, Giovannoni JJ. (2004) Comprehensive EST analysis of tomato and comparative genomics of fruit ripening. Plant J. 40, 47–59
3. Rensink WA, Lee Y, Liu J, Iobst S, Ouyang S, Buell CR. (2005) Comparative analyses of six solanaceous transcriptomes reveal a high degree of sequence conservation and species-specific transcripts. BMC Genomics. 6, 124
4. Ronning,C.M. et al. (2003) Comparative analyses of potato expressed sequence tag libraries. Plant Physiol. 131, 419–429
5. Guo J, Zhu P, Wu C, Yu L, Zhao S, Gu X. (2003) In silico analysis indicates a similar gene expression pattern between human brain and testis. Cytogenet Genome Res. 103, 58-62
6. Benjamini, Y., Daniel Yekutieli. (2001) The control of the false discovery rate in multiple hypotheses testing under dependency. Annal. Stat. 4(29), 1165–1188
7. Tsai CA, Hsueh HM, Chen JJ. (2003) Estimation of false discovery rates in multiple testing: application to gene microarray data. Biometrics. 59, 1071-81
8. Audic S, Claverie JM. (1997) The significance of digital gene expression profiles. Genome Res. 7, 986–995
9. Roche 454 : Products & Solutions - Multiplexing
(http://www.454.com/products-solutions/experimental-design-options/multiplexing.asp)
10. Tatusov RL, Koonin EV, Lipman DJ. (1997) A genomic perspective on protein families. Science. 278, 631-637
11. Kato T, Murata Y, Miura K, Asai K, Horton PB, Koji T, Fujibuchi W. (2006) Network-based de-noising improves prediction from microarray data, BMC Bioinformatics. 7, S4
12. Noh SJ, Lee K, Paik H, Hur CG. (2006) TISA: tissue-specific alternative splicing in human and mouse genes. DNA Res. 5, 229-243
13. Zeeberg BR, Feng W, Wang G, Wang MD, Fojo AT, Sunshine M, Narasimhan S, Kane DW, Reinhold WC, Lababidi S, Bussey KJ, Riss J, Barrett JC, Weinstein JN. (2003) GoMiner: a resource for biological interpretation of genomic and proteomic data, Genome Biol. 4, R28
14. GeneSpring GX : Products & Services - GeneSpring GX Software
(http://www.chem.agilent.com/en-US/products/software/lifesciencesinformatics/genespringgx/pages/default.aspx)
15. Wingender E, Chen X, Hehl R, Karas H, Liebich I, Matys V, Meinhardt T, Prüss M, Reuter I, Schacherer F. (2000) TRANSFAC: an integrated system for gene expression regulation. Nucleic Acids Research. 28, 316-319
16. PathwayStudio : Products-pathway Studio
(http://www.ariadnegenomics.com/products/pathwaystudio/)
17. Eveland AL, McCarty DR, Koch KE. (2007) Transcript profiling by 3'-untranslated region sequencing resolves expression of gene families. Plant Physiol. 146, 32-44.
18. Torres TT, Metta M, Ottenwälder B, Schlötterer C. (2008) Gene expression profiling by massively parallel sequencing. Genome Res. 1, 172-7.
19. Vega-Arreguín JC, Ibarra-Laclette E, Jiménez-Moraila B, Martínez O, Vielle-Calzada JP, Herrera-Estrella L, Herrera-Estrella A. (2009) Deep sampling of the Palomero maize transcriptome by a high throughput strategy of pyrosequencing. BMC Genomics. 10, 299.
20. Wang ET, Sandberg R, Luo S, Khrebtukova I, Zhang L, Mayr C, Kingsmore SF, Schroth GP, Burge CB. (2008) Alternative isoform regulation in human tissue transcriptomes. Nature. 2456, 70-76.
21. Johnson JM, Castle J, Garrett-Engele P, Kan Z, Loerch PM, Armour CD, Santos R, Schadt EE, Stoughton R, Shoemaker DD. (2003) Genome-wide survey of human alternative pre-mRNA splicing with exon junction microarrays. Science. 302, 2141-2144.
22. Ledford H. (2008) Human genes are multitaskers. Nature. 456, 9.
23. CLC Genomics Workbench: RNA-Seq analysis
(http://www.clcbio.com/index.php?id=1330&manual=RNA_Seq_analysis.html)
Posted by 人Co
- Tag
- Cluster, DEP, Digital Expression Profile, Expression, Expression pattern, insilicogen, Library Normalization, NGS, Normalization, Unigene Normalization, 마이크로어레이
- Response
- No Trackback , No Comment
- RSS :
- https://post-blog.insilicogen.com/blog/rss/response/46