[Quipu Issue Paper] Epigenomics Ⅰ - Methylation Analysis
- Posted at 2010/03/08 11:26
- Filed under 생물정보
연재 순서
1. Assembly
2. Variation study
3. Expression study
4. Epigenomics
5. Genome Annotation
6. Next Generation Bioinformatics
7. Data Management for web 2.0 Era
8. Semantic Network for Integrated Biology Data
9. Gene Network Discovery by Text-mining
10. Centralization for High-throughput Data Analysis
이번주 연재에서는 Next Generation Sequencing의 세 번째 Application으로 유전자의 염기서열에는 변화를 주지 않으면서 유전자의 발현 등에 영향을 주어 개체의 차이를 나타내게 하는 현상에 대해 연구하는 Epigenomics의 분석 방법에 대해 알아보겠습니다.
2003년 인간 유전체에 대한 서열해독 이후로, 유전체에 대한 기능적 분석에 연구가 증가하면서, 이른바 post genomics시대가 도래하고 유전체 연구와 함께 이들의 발현과 작용에 대한 연구들이 활발해 지고 있다. Epigenetics라는 분야는 이러한 흐름을 주도하는 분야로서, 유전되는 DNA서열로만 설명이 불가능한 부분의 해석을 돕고, 보다 발전적인 유전체 연구를 목적으로 진행되고 있다. Epigenetics에서 가장 주요하게 여겨지는 부분은 유전자의 발현으로서, 유전자가 유전체에 존재하지만, 발현여부에 따라 세포내 역할이 달리지고, 달라진 발현양상은 유전물질처럼 후대에게도 영향을 주는 것이다. 이는 기존의 유전체가 답하지 못했던 물음에 실마리를 제공하면서, 유전체를 좀 더 잘 이해하기 위한 수단으로 이용되고 있다[1].
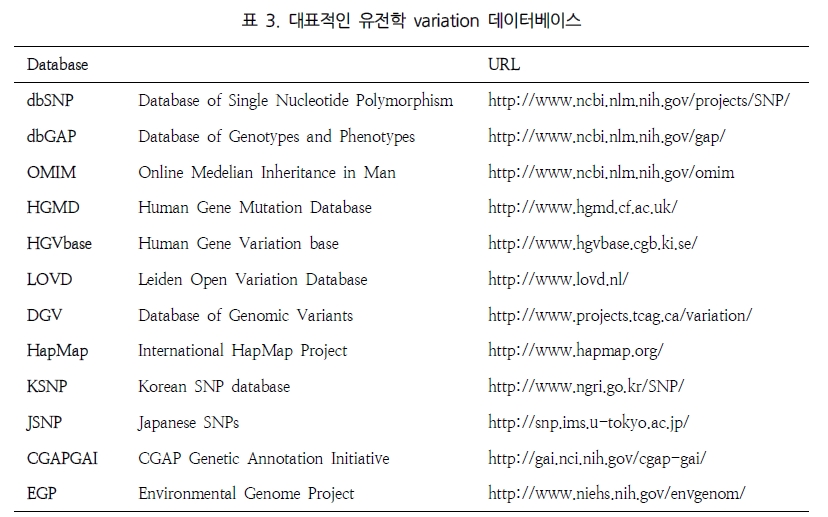
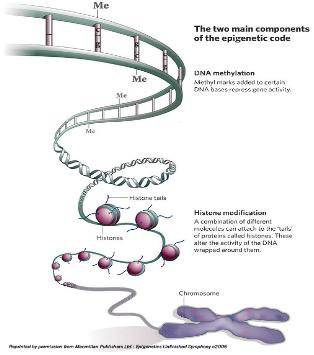 그림 1. DNA methylation에 의한 유전자 발현 및 억제
Genome methylation을 알아보기 위한 기존의 방법은 Methylation Sensitive Restriction Enzyme (MSRE)을 이용하거나, 살펴보고자 하는 특정 영역에 해당하는 프라이머를 작성하여 PCR을 수행 하는 방법 등이 이용되었다. 그러나 NGS 기술의 발달로 epigenetics 분야의 연구 또한 대량의 functional gene study가 일반화 되어가고 있다. 가장 대중적인 방법은 genomic DNA를 추출하여 bisulfate를 처리한 후에 NGS를 통한 대량 sequencing을 수행하는 것이다(그림 2).
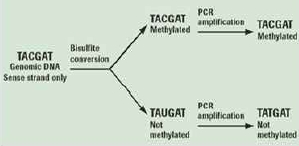 그림 2. Genomic DNA의 bisulfate처리로 methylation 여부를 확인.
1. Assembly
2. Variation study
3. Expression study
4. Epigenomics
5. Genome Annotation
6. Next Generation Bioinformatics
7. Data Management for web 2.0 Era
8. Semantic Network for Integrated Biology Data
9. Gene Network Discovery by Text-mining
10. Centralization for High-throughput Data Analysis
이번주 연재에서는 Next Generation Sequencing의 세 번째 Application으로 유전자의 염기서열에는 변화를 주지 않으면서 유전자의 발현 등에 영향을 주어 개체의 차이를 나타내게 하는 현상에 대해 연구하는 Epigenomics의 분석 방법에 대해 알아보겠습니다.
2-3. Epigenomics
2003년 인간 유전체에 대한 서열해독 이후로, 유전체에 대한 기능적 분석에 연구가 증가하면서, 이른바 post genomics시대가 도래하고 유전체 연구와 함께 이들의 발현과 작용에 대한 연구들이 활발해 지고 있다. Epigenetics라는 분야는 이러한 흐름을 주도하는 분야로서, 유전되는 DNA서열로만 설명이 불가능한 부분의 해석을 돕고, 보다 발전적인 유전체 연구를 목적으로 진행되고 있다. Epigenetics에서 가장 주요하게 여겨지는 부분은 유전자의 발현으로서, 유전자가 유전체에 존재하지만, 발현여부에 따라 세포내 역할이 달리지고, 달라진 발현양상은 유전물질처럼 후대에게도 영향을 주는 것이다. 이는 기존의 유전체가 답하지 못했던 물음에 실마리를 제공하면서, 유전체를 좀 더 잘 이해하기 위한 수단으로 이용되고 있다[1].
Epigenomic study의 연구대상으로 가장 대표되는 것이 DNA-methylation이다. DNA strand에서 CpG island가 있고 이중 cytosine이 5-methyl cytosine으로 modification 되는 현상이다. 이러한 methylation 현상은 유전체 전반에 걸쳐 일어나는 것으로 유전자의 단백질 코딩 영역이나 전사 조절 부위에서 관찰이 되며 이는 곧 유전자의 발현에 관여하게 된다[2]. 대표적인 예로 X-염색체 inactivation을 통한 유전자 dosage 조절이나 발달과정에서 필요한 유전자들의 발현을 성장 시기에 맞춰 선택적으로 조절 하는 것이 이에 해당 한다. 뿐만 아니라 외부의 retro virus나 transposon의 발현 억제와 cancer에 의한 repressor 유전자의 inactivation 기작 역시 DNA methylation을 통해서 이루어지고 있어 질병과 관련하여 유전체 연구에서 중요하게 다뤄지고 있다.
2-3-1. Methylation Analysis
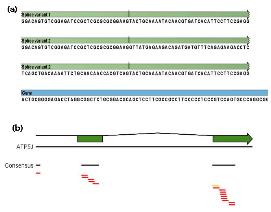
Genome methylation을 알아보기 위한 기존의 방법은 Methylation Sensitive Restriction Enzyme (MSRE)을 이용하거나, 살펴보고자 하는 특정 영역에 해당하는 프라이머를 작성하여 PCR을 수행 하는 방법 등이 이용되었다. 그러나 NGS 기술의 발달로 epigenetics 분야의 연구 또한 대량의 functional gene study가 일반화 되어가고 있다. 가장 대중적인 방법은 genomic DNA를 추출하여 bisulfate를 처리한 후에 NGS를 통한 대량 sequencing을 수행하는 것이다(그림 2).
Methylation 되어 있지 않은 cytosines은 bisulfite 처리로 uracil로 바뀌게 되고 반면,
methylation 되어 있는 cytosines에는 변화가 없어 genome상의 서열변화로 methylation 여부를 확인한다[3].
methylation 되어 있는 cytosines에는 변화가 없어 genome상의 서열변화로 methylation 여부를 확인한다[3].
시퀀싱 된 NGS reads는 reference assembly를 통해 유전체 내의 전체적인 5-methyl cytosine의 분포를 확인 하는데 이용하게 된다. 이러한 분석은 ABI-SOLiD, Illumina의 Solexa 그리고 Roche 454 모두 가능한 플랫폼이긴 하나 long reads 시퀀싱을 수행하는 Roche 454가 조금 더 유용하게 이용되고 있다[3].
다음 연재에서는 단백질에 binding된 DNA 서열을 분리하여 NGS 방식의 시퀀싱 통해 binding site를 동정하는 방법인 CHIP-Seq 분석 방법에 대해 알아보겠습니다.
많은 관심 부탁드립니다.
참고문헌
1. Horner DS, Pavesi G, Castrignanò T, De Meo PD, Liuni S, Sammeth M, Picardi E, Pesole G. (2009) Bioinformatics approaches for genomics and post genomics applications of next-generation sequencing. Brief Bioinform. [Epub ahead of print]
2. Weber M, Schubeler D. (2007) Genomic patterns of DNA methylation: targets and function of an epigenetic mark. Curr Opin Cell Biol. 19, 273-80
3. Roch 454 : Applications - Epigenetics
(http://www.454.com/applications/ChIP-seq-methylation-epigenetics.asp)
4. Illumina : Applications - Gene Regulation and Epigenetic Analysis
(http://www.illumina.com/applications.ilmn#dna_protein_interaction_analysis_chip_seq)
5. Appied Biosystems : Applications & Technologies - The SOLiD System
(http://www3.appliedbiosystems.com/AB_Home/applicationstechnologies/SOLiD-System-Sequencing-A/index.htm)
6. Kel, A., Voss, N., Jauregui, R., Kel-Margoulis, O. and Wingender, E. (2006) Beyond microarrays: Find key transcription factors controlling signal transduction pathways BMC Bioinformatics. 7, S13
Posted by 人Co
- Tag
- ABI-SOLiD, CHIP-Seq, CpG island, cytosine, DNA methylation, Epigenomics, Illumina Solexa, insilicogen, MSRE, NGS, repressor, Roche 454, uracil, 인실리코젠
- Response
- No Trackback , No Comment
- RSS :
- https://post-blog.insilicogen.com/blog/rss/response/53